 There’s something about subduction zones. Maybe it’s the potential for magnitude 9+ earthquakes and major tsunamis... and for silent earthquakes, and slow slip events, and postseismic deformation. Maybe it’s the explosive volcanoes. Maybe it’s the accretion of stuff scraped off the downgoing plate. Maybe it’s my old fondness for minerals that look purple under a microscope. Maybe I’ve just been seduced by the name.
Anyway, although I’ve worked in rocks that have been down in subduction zones, I don’t have a very good idea about the nature of the faults that generate the immense earthquakes. I work on land, and on rocks that have made it to the earth’s surface; the subducting plate starts on the ocean floor, and goes down from there. So I don’t have a mental image of what’s involved – not like I have of, say, the Wasatch normal fault, or the Snake Range decollement.
An article in last week’s Science by Nadege Hilairet and co-authors, about experimental deformation of serpentine, gives me a better idea.
Minerals can deform in a number of different ways, depending on the temperature, the stress they experience, and the rate of deformation. At low temperatures, things deform elastically - they change shape in response to the stress until either the stress goes away, or they break. At higher temperatures, chemical bonds break and reform within the crystals, allowing the crystals to change shape without physically breaking. This can lead to some major differences in behavior when the rocks are stressed – at low temperatures, the release of elastic energy when rocks break and slip gives us earthquakes. At high temperatures, rocks behave more like Silly Putty – they’re elastic at short time scales (and can transmit seismic waves), but over longer times, they change shape at a rate that’s proportional to the stress they feel.
Different minerals deform by different mechanisms. Some change shape ridiculously easily – rock salt, for instance, flows so easily that it is used to equalize pressures in rock deformation experiments. Others, such as olivine, are strong even at quite high temperatures – that is one reason why the uppermost part of the mantle, the mantle lithosphere, is the strongest part of most tectonic plates.
And then there’s serpentine, the hydrous magnesium-iron-aluminum silicate that forms from adding water to mantle rock. It’s the mineral that dominates the state rock of California (and the rock found in the core across the San Andreas Fault). And it is, presumably, a mineral that forms in the mantle wedge above the subducting plate, as the downgoing plate loses its water. (Some subduction zones also have evidence that it really is there – seismic waves traveling through the overriding plate are slowed by a material that has the right seismic velocity and other elastic properties to be serpentinite.)
Serpentine is soft and slippery at surface conditions, so one might expect it to be weak in subduction zones, as well. But serpentine is brittle in low-pressure experiments (below 0.7 GPa, which would be equivalent to a depth in the neighborhood of 20 to 25 km) – near the surface, it breaks. The authors, however, managed to do deformation experiments at pressures of 1 to 4 GPa (equivalent to around 33 to 120 km – for a subduction zone beneath a continent, we’re talking about depths from the average base of continental crust to the base of the mantle lithosphere – though at a subduction zone, I’m not sure what is typically found at those depths).
They found that serpentine behaves differently at different pressures, presumably because different deformation mechanisms are at work. At both pressures, the behavior could be modeled as power-law creep. Power-law creep means that the strain rate is related to stress taken to some power n – that is, the higher the stress, the faster the strain rate, and the higher the value of n, the more sensitive strain rate is to increases in stress. Power-law creep is typical of deformation mechanisms involving movement of dislocations (defects in a crystal lattice). But at lower pressures, the stress exponent was higher – increasing stress really made deformation happen more quickly – which is typical of sliding along grain boundaries. At higher pressures, the behavior was closer to that of a viscous material (though still with viscosities that change with stress).
Ok, nice. So why, exactly, is this interesting? Well, for one thing, I usually think about the effect of temperature on deformation mechanisms, but I don’t usually see discussions of the role of pressure. Temperature’s important because intracrystalline deformation involves breaking chemical bonds, and higher temperatures generally make it easier to break and re-form bonds. In fact, I had always thought about the great depths of subduction-zone earthquakes as a function of the cold temperatures in the subducting slab. (The rock descends faster than heat can flow into it – among other things, that makes high pressure/low temperature metamorphic rocks possible.) So it’s interesting to see rheology controlled by pressure as well.
For another, the experiments show that, at depths in the range of approximately 30 to 100 km, serpentine is much weaker than most other likely minerals (pyroxene, plagioclase, and wet and dry olivine – the likely constitutents of oceanic crust and mantle). Is the likelihood of large earthquakes on subduction zones governed by the presence or absence of serpentine, rather than age of subducting crust or rate of plate movement? This would seem difficult to test, but if the seismic velocity and Poisson ratio of serpentinites are unusual, maybe tests are possible.
And what about those weird not-really-earthquake events that take place? Silent earthquakes, like the ones along the Cascadia subduction zone beneath Vancouver Island? Or afterslip – slow movement after a major earthquake, like occurred after the 2004 Boxing Day earthquake off Sumatra? (GPS data suggests that, during the month after the earthquake, slow slip equivalent to a M 8.7 earthquake occurred (Subarya et al., 2006).) The authors calculate that stresses in serpentine should relax on the same time scales described for slow earthquakes and afterslip, and imply that serpentine could explain some of the things that have been observed. There are some problems with that explanation, though. Modeling of afterslip following the Sumatra earthquake (Subarya et al., 2006), placed the slip in the same area as the initial earthquake, at depths shallower than 25 to 50 km, depending on the model they used to invert their ground deformation data. And Hilairet et al. cite studies saying that Sumatra has no evidence of serpentinization. So...the pieces don’t all fit together. Not perfectly.
This study, plus the recent study that found talc in the San Andreas Fault, are interesting because they tie together mineral behavior, rock mechanics, and seismology. The combination seems fruitful. I’ll be interested to see how the modelers who study triggered earthquakes work with these data.
References:
Hilairet, N., Reynard, B., Wang, Y., Daniel, I., Merkel, S., Nishiyama, N., and Petitgirard, S., 2007, High-pressure creep of serpentine, interseismic deformation, and initiation of subduction: Science, v. 318, p. 1910-1913.
Subarya, C., Chlieh, M., Prawirodirdjo, L., Avouac, J-P., Bock, Y., Sieh, K., Meltzner, A.J., Natawidjaja, D.H., and McCaffrey, R., 2006, Plate-boundary deformation associated with the great Sumatra-Andaman earthquake: Nature, v. 440, p. 46-51, doi:10.1038.
Monday, December 31, 2007
Serpentine rheology and subduction zone earthquakes
(Half of) 2007 in retrospect
I wasn't going to do the meme in which we post the first sentence of the first post of each month. I only started blogging in June, after all. But it does seem like a good way to reflect about the year, so here it is:
- June: NPR has had this series, off and on, in which listeners record interesting sounds and then explain them on the air. (The Sound of Mylonites)
- July: As students walked into my Earth Systems Science class on the first day of fall semester, 2005, they saw a satellite image I had just grabbed from NOAA’s website: Hurricane Katrina, aimed straight at New Orleans. (book rec: Storm World by Chris Mooney)
- August: Chris Rowan had a very thought-provoking post a couple days ago based on a suggestion by Propter Doc: that all scientific journal articles should include (possibly on the web, rather than in a print version) a lay statement written by the authors of the journal article. (summaries for non-scientists: what should they contain?)
- September: I grew up on the second-most-polluted lake in the state of Maine. (of lakes and rocks (or why I do what I do))
- October: I found the pink caldera on the China/North Korean border, so it's my turn to post something. (Where on (Google) Earth #56)
- November: I just got back from a two-day microprobe marathon - two days on what's essentially a scanning electron microscope that can do chemical analyses of very small crystals. (Teeny-tiny partial melt)
- December: My intro students turned in their papers for my new, kind-of-experimental, revised group project yesterday. (Teaching: a comment I like to hear)
I find the end of December an odd time for musing about endings and beginnings. The winter solstice makes me want to hibernate until the days get longer, and feels like a time for waiting, rather than a time for making changes. The equinoxes feel more like a time of change to me - the autumn equinox, in particular, feels like a time for new beginnings. (Maybe that's the result of the academic cycle, though, rather than the cycle of seasons.)
But today's the day that our year ends, so... patterns and resolutions:
- This blog has changed from me talking to myself about things I saw or things I read, to me talking to other people. It's nice to be part of a community, but I would like to go back to writing about odd observations more often.
- As the fall semester progressed, I talked about teaching more and more. Perhaps that's normal, given that I was teaching four courses and three labs.
- It's been a while since I've played Where on (Google) Earth.
- I can't decide which rules to follow for capitalizing post titles. GSA rules, in which only the first letter is capitalized? The rule of titles I learned as a kid, in which all nouns and verbs are capitalized? The Lazy Internet Rule, in which nothing is capitalized unless I want to draw attention to it? I can't figure out what looks best on the blog, and what looks best on the geoblogosphere widget that I haven't figured out how to install.
- I want to do more blogging about peer-reviewed research. (Once a month seems like a good goal - it would make me set aside time to read articles, even during the busy time of the semester.) I love teaching, but it's easy to miss what's new in a discipline when I've got so many classes, and I don't want to become one of those greying professors whose classes forever reflect the ideas that were current when they were in graduate school.
- I'm also going to try to post some kind of photo every month, and talk about what I see. I've got a bunch of digital photos that I took last year, but never got around to blogging about them - perhaps they can fill the time until I can go outside. (Or I can post pictures of deformation in Silly Putty or chocolate chip cookies, for that matter.)
- And there are things that I started talking about last year - things that need finishing. I haven't looked at the pre- and post-tests I gave before showing An Inconvenient Truth, for instance, so I don't know whether the movie was useful at all.
Friday, December 28, 2007
Good idea: appreciating high school science teachers
Over at Apparent Dip, Thermochronic writes about appreciating his high school chemistry teacher, and suggests taking a moment to contact the teachers who influenced us and tell them so.
I graduated from high school 23 years ago, and a lot of the teachers who influenced me have retired. And the teachers who helped me most were a high school history teacher, and a sixth grade everything (including very good science) teacher.
Miss H. knows, I think, that she influenced me more than any of the other teachers in my high school. (At some point my college sent something to teachers that had influenced us. I don't remember the context, but I remember that Miss H. sent me a wonderful letter thanking me for mentioning her.) Miss H. taught history, but that wasn't all she taught. She started Ancient (European) History in the Paleozoic - despite, as I later learned, having found her introductory geology class incredibly boring. I suspect that there was some tension amongst the teachers about the unwillingness of either the biology or earth science teachers to teach things like evolution and the age of the earth. So a history teacher took up the slack. She also taught me to write research papers, and had us read historically relevant English literature (A Tale of Two Cities and Animal Farm). She pushed me to think, and to be goofily enthusiastic about intellectual pursuits. And that was as important for doing science as learning the content was.
Mrs. S. taught my sixth grade class - everything except social studies, if I remember correctly. She was the one who first told me to "tell them what you're going to tell them, then tell them, then tell them what you told them." (I told her that sounded stupid. I was punished for mouthing off, but I remembered the lesson in the end.) But what I really remember was a very creative physics/engineering lesson. We had to build something and - I don't remember whether we explained it to the class, or made a poster about it, or wrote a paper about it. But, anyway, my project involved transformers. (Not the toys - they, ummm, didn't exist yet then.) That was where I learned the relationship between electricity and magnetism. That project is the entire reason why I can trouble-shoot machines at all. I still think about it when I try to explain the earth's magnetic field, or when I read an explanation of how plasma is formed in our ICP, or when my car won't start. It was the first time a teacher had had me build something with wires and magnets and... well, it was really cool. I was rarely asked to create things with my hands (other than neat handwriting) - it was wonderful to be practical as well as theoretical.
Neither of them are teaching in the district any more. My mother might know how to contact them - so here's my appreciation, in public.
Thursday, December 27, 2007
Carbonates and housecleaning
It's winter break. I'm home with the four-year-old, building a lot of things with Legos, playing snow leopards (we've been watching the Planet Earth series), and pretending to do some year-end cleaning.
There are a few household maintenance things that I... well, I should do them more often than I do. Turn the mattress on the bed, for instance. Change the air filter on the heating system. And change the wicking filter on the humidifier.
We got a medium-sized humidifier during the summer of 2002, when we were about ten miles from the edge of one of the many fires that were burning in the western US. Normally we cool our house in the summer by simply opening the windows at night. We live at 7000 feet, and it gets pretty cool here. But during the fire, the smoke settled into the valleys at night, and we kept the windows closed to keep it out. I had just finished my second year teaching here, and I had taught Earth Systems Science four times in a row, and I was all psyched to try cooling using evaporation. I wanted a swamp cooler, but I had no idea what I was looking for, so I came home with a humidifier and a fan. I'm not sure the humidifier did anything for the temperature, but it made the air in the house easier to breath. So now we usually turn it on at night, and fill it with water that we collect in old yogurt containers when we're getting ready to get into the shower. (Yes, I know a grey-water system might have been a better use, and might have allowed us to have a lawn that consists of more than twelve blades of buffalo grass. But I'm not a plumber. That's on the list of renovations I want to do.)
Anyway, whether or not the humidifier is useful, it only works when water can soak into its wick and then evaporate. That works for a while, but eventually, minerals precipitate on the top of the wick, and it needs to be replaced. So one of my missions yesterday was to find a new wick for the humidifier.
My first try was the locally-owned hardware store where I had bought the humidifier. They still carried the wicks, but they were out. So I tried Wal-mart. No luck; they only carried a handful of humidifiers. Same with Home Depot. In fact, the guy working there rolled his eyes and showed me the shelf full of DE-humidifiers that the main office kept sending them.
"They don't understand 25% humidity," he told me.
"Are they in Houston?" I asked.
"Atlanta," he replied.
So: three places in town that sold hardware, and no luck finding the wicks. I went home and looked at the crusty stuff on the wick, and thought cranky thoughts about the precipitation of calcite and other annoying non-silicate minerals. At least, I figured it was probably mostly calcite. Calcium is by far the most abundant cation dissolved in the nearest river, and even though my groundwater comes from a poorly sorted sandstone, I figured calcite was the most likely mineral. No acid to test it, though...
Wait a minute.
No, I don't keep a stash of hydrochloric acid at home. (Four-year-old in the house.) But I do, however, keep vinegar around. And vinegar's acidic.
In fact, I thought, maybe I could just clean the wick with vinegar. Dissolve off the precipitates, and put it back in the humidifier, good as new.
So I pulled out the wick and put it in the bathtub, and brought the bottle of vinegar upstairs. I poured a little vinegar on the precipitates, and...
Oh, yes. The satisfying FIZZZZZZZZZZZZZ of calcite in acid.
I poured more vinegar on it. It fizzed some more.
I plugged the tub, and kept pouring vinegar, trying to think of a way to make sure the vinegar had time to dissolve as much carbonate as possible.
Half an hour later, I had orange vinegar in my bathtub (not sure where the orange came from; I don't think there's much iron dissolved in my water), and an empty vinegar bottle.
The wick is still pretty crusty, and very soggy, and still needs to be replaced.
Maybe I'll have to try HCl next time.
Thursday, December 20, 2007
Teaching: more on graphs and research in intro classes
While I'm on break between semesters, I'm working on revising and improving a new intro class group project that I introduced this past semester. (The lab sections are going to monitor a local stream, similar to what groups like Colorado Riverwatch do. We've got four to six lab sections, and each one will collect data from a different reach of the stream.) I'm especially trying to use this project to help students learn how to understand graphs better.
My experience this semester was mixed. That isn't surprising: a senior thesis student was still collecting baseline data, and a lot of the project was designed on the run. But I was still disappointed with the way the students interpreted their data. Several groups assumed that they could extrapolate data between data points when the data were collected at specific times two months apart. And I wasn't convinced that most of the students understood the numbers they had, or the units things were measured in, or the significance of the values.
So... it's another semester, and I'm revising the exercise. (It's rare that any new exercise works perfectly the first time around, anyway.) We're going to spread the exercise through several weeks (for fifteen minutes or so at the beginning of lab - we aren't going to cut other labs to make room for this one). Here's the basic schedule:
Week 1 - introduce project, use topo maps from field sites for the topographic maps lab
Week 2 - graphing-by-hand exercise, using monthly average discharges for the 2006 water year. This will be complicated because there is a reservoir between two of the sites, so they will graph data upstream and downstream of the reservoir. Hopefully, besides practicing their graphing skills, they will also start thinking about how water is stored and used in the western US.
Week 3 or 4 - use Excel to graph the fall 2007 data collected by the senior thesis student. (There will be a field trip on the other week. We live in the Southwest, and it can be clear and fairly warm, even in January. More field trips! Yay!)
Week 5 - choose groups (discharge, sediment, or one of two water chemistry groups) and write one page of background on the type of data being collected. (What is it, what controls whether it is high or low, why do we care about it.)
Week 6 - write one page (or less) about what they expect (given location of the field site, previously collected data, what they know about the weather at that time of year).
Week 8 - collect data in field.
Week 9 - ICP analysis for one of the water chemistry groups. (I still haven't figured out how to let the students see what the instrument does, without making them spend the entire day in the lab with me.)
Week 10 - enter group data in Excel spreadsheet. (I've thought about using Google docs for this, but most of the students don't currently have gmail accounts. For this semester, I'm going to have the lab professor enter the data as students read it off.)
Week 12 - presentation and discussion of results. (Each group will present their original results, and then we'll discuss what they mean in the context of the other groups' results. I'm going to use Moodle to allow the students to share their powerpoints and graphs with one another.)
Week 14 - final papers on the project due.
I spent a good part of this week reorganizing the data in Excel, in hopes that I could make the entire graphing process simple enough that students could learn anything from it. Now, I know that Real Scientists don't use Excel. (Though, ummm, I do. Not for complex math, but for organizing data and doing simple calculations. It works pretty well for recalculating mineral compositions from microprobe data, and for doing unit conversions, and for calculating stream discharge.) And I also discovered that, ARGH, Excel 2007 has really been reorganized, and I had to relearn everything I had known about making graphs in Excel. (I'm still not sure how to remove the graphs from the data without losing everything... it must be possible to make the graphs static, not dynamic, but I haven't figured out how yet.)
But besides the general frustrations of working with newly updated software, I discovered a few other things that might be pedagogically interesting:
- Excel doesn't really care what units are associated with what data. It will happily (as a default) plot discharge, pH, turbidity, and ppm of Na dissolved in water... all on the same Y axis. It takes a bit of work to choose what to plot against what.
- The easiest X-Y plot to read (scatter connected by lines) helps a reader to keep track of which data points go together, but it suggested a continuity in the data that doesn't really exist.
- On the other hand, Excel recognizes dates, and spaces them with appropriate distances between them. That's nice, because the senior collected data in July, and then went off to work as a river guide for six weeks before coming back to really start work in September.
I'm asking students for examples of situations when they shouldn't plot data on the same graph. One has to do with units. But because I want them to see the changes in each variable through time (or along the length of the river), I also want them to think about whether the changes will be visible if both types of data are plotted on the same graph. (If one element is present at 0.1 ppm levels, and another is present at 100 ppm, then changes in the element with the low concentration are impossible to see.)
I'm also asking the students to look at the graphs and notice (qualitatively) which variables seem to rise and fall together, and which have opposite patterns, and which seem entirely unrelated.
And now, after a lot of cutting and pasting in Excel, I'm wondering: is this going to be enough? Too much? Will they learn anything from this? Will they be bored to tears, or will they see patterns that make them more curious?
Edit: I thought about another issue while I was waking up this morning.
Using Excel requires access to computers. We've got a department computer lab, but it only has four computers. We've got wireless access in the geology labs, but not all students have their own laptops. (Perhaps more do than I am aware. I'll have to ask them at the beginning of the semester.) There are computer classrooms on campus, but they are in high demand, and I don't want to drag the class across campus for a short exercise.
So. If they don't have access to their own laptops, which is more important: having all the students use Excel themselves, or having the instructor available while they work? I could have them work in groups in out computer lab (but then only one person touches the computer), or I could make this a homework assignment (and make them complete it without being able to call me over whenever they got stuck).
Maybe most of the students will have wireless-enable laptops, and we'll be able to work in the classroom. That would be ideal...
Tuesday, December 18, 2007
Seven things you didn't know about me
I was tagged by Chris R. for this meme. So... here it goes.
1. My high school biology teacher was a young earth creationist, and I have never had a biology class that covered evolution, though I used to read the last chapter of grade school textbooks - the one that talked about human evolution - on my own. My high school history teacher tried to make up for our inadequate science education by starting Ancient History with the Paleozoic.
2. I chose my undergrad college because the glossy propaganda included a picture of a snow sculpture of a lake monster.
3. I chose my graduate school because it does not snow there. Not in April, when I visited. Not in January. Not at all.
4. Within three months of arriving in grad school, I missed snow so much that I decided to do field work in northwestern Alaska.
5. All of my academic jobs have been in ski towns, even though I am a Nordic (not Alpine) skier.
6. After my first job interview, I was told that I was not enthusiastic enough about teaching, and that I should consider applying for jobs at research universities. So the next time I got an interview, I asked lots of detailed questions about the courses I would be teaching, and I went to the interview with a lot of ideas about the classes. (I got that job, and I have never applied for a job at a research university.)
7. At one point, I knew how to ask for beer in French, Spanish, German, Russian, Japanese, and Chinese. However, I prefer to drink red wine.
I'm not going to tag anyone, because I don't want to put anyone on the spot. But if you want to play, consider yourself tagged.
Friday, December 14, 2007
My deskcrop has dizzy feldspars
I had a bit of a problem with this month's Accretionary Wedge (which is why I'm late posting). I don't actually have any rocks on my desk at the moment - I've just turned in grades, which means my desk is currently covered with textbooks, unread issues of GSA Today, unopened mail, scribbled notes from phone calls, a slinky, a pair of fault blocks, a pile of scrap paper that was meant to be used for a discussion about triple junctions, and possibly my missing coffee cup.
So I had to dig through the drawers of a rock cabinet, instead. (I rescued a lovely old wooden rock cabinet last time one of my colleagues was getting rid of stuff, and now my teaching collection is organized. Which is a good thing, because I can't find anything on my desk.)
I found this rock in an overgrown field in central Massachusetts. My field partner and I were following an old field trip guide, looking for the Pelham dome. I'm still not quite sure if we found it or not. But we did find this: a perfect example of a shear-sense indicator for class.
Metamorphic rocks usually do a rather imperfect job of telling about their deformational history. The minerals recrystallize as the rock changes shape, and it is possible that, several hundred million years later, it will be impossible to tell if the rock was squished or smeared. Squishing (otherwise known as pure shear) is what happens if you flatten bread dough by pushing down on it. Smearing (otherwise known as simple shear) involves deforming an object between two sides slipping past one another - imagine what would happen to the bread dough if it were caught within a fault zone (other than just getting really dirty, I mean, and possibly making an earthquake rupture less likely). A combination of the two is also possible - a rolling pin flattens dough by a combination of pure shear and simple shear.
If you want to know just how a rock changed shape, it helps to have a way to tell apart pure shear and simple shear. Generally, you need to find some kind of object that has tracked the movement - and this rock has one.
That feldspar has done a bit of spinning.
Objects that are caught in a shear zone should rotate. But they rotate at different rates depending on their shapes. Spherical objects will roll forever at the same rate - try rolling a marble between your hands. But flat objects will rotate fast when they're at a high angle to the shear zone, but will slow down and get stuck parallel to the shear zone boundaries. (Try rolling a poker chip between your hands.) In this rock, the white feldspar has grown a pair of tails (which also tell a story about deformation), and then the round center kept spinning while the tails stayed in place.
That kind of grain is called a "delta porphyroclast," because it looks a bit like the Greek letter delta, and because... well, I don't really know the etymology of "porphyroclast," to be honest. But it's a good word, however it got into geologic terminology.
Dizzy feldspars may not know where they've been, but they can tell you a bit about how they got there.
(The observant reader may note the red pen on top of the sample. That's not just there because my grading wasn't quite finished. The pen shows the direction of the stretching lineation - the direction that the rock was stretched during deformation. If you want to see shear sense indicators, you need to look at the side of the rock that's parallel to the lineation, and also perpendicular to the foliation, which in this rock is defined by the dark- and light-colored layers.)
Wednesday, December 12, 2007
So you're applying to graduate school...
Female Science Professor has posted a very useful discussion of e-mails to potential graduate advisors. If you are an undergrad applying to graduate school, you might want to check out her comments - it isn't often that you get insight into what grad school faculty want to hear from applicants! The comments also give a view of the range of opinions about pre-application e-mails.
(My experience... well, I had to walk uphill both ways in a snowstorm just to search a paper copy of the Directory of Geoscience Departments to find out which universities employed metamorphic petrologists. I suppose I could have sent pre-application letters via the Pony Express... *shakes cane* So, anyway, I'm glad to hear what faculty at research universities think of the now-traditional e-mails.)
Edit: Female Science Professor has added a new post discussing applications of MS vs PhD students. It's a useful read, as well. But keep in mind that she teaches at a major research university - there are a range of types of institutions out there, and for some of them, the terminal MS degree is the most advanced degree offered. If you are primarily interested in going into industry rather than academia, an MS degree might be the way to go - especially right now, when both the oil&gas and mining industries are hiring geologists. (They are also hiring people with PhDs, but PhDs take a lot longer to complete, and the job market can change a lot in five years.)
Friday, December 7, 2007
Visualizing heat flow around a pluton?
Here I am, not going to AGU. I'll do some end-of-semester blogging this weekend. But in the meantime, I'm looking for a new(ish) visualization tool.
Contact metamorphism happens when magma intrudes rocks and heats them up. It's possible to calculate how hot rocks should get at various distances from a body of magma, and to predict the mineral assemblages that one should find, and how quickly the rocks should cool off. It involves partial differential equations, but they've been used since the early 1900's. There's an analytical solution for the one-dimensional simplification*, and there has been plenty of modeling of other geometries and the effect of fluid flow. I've used some models myself in past research.
But I don't have a good, interactive demo that students can use to figure out what the equations mean.
I'm not looking for a Matlab script or anything complicated for research. I'm looking for something that a student could play with to see if a pattern of metamorphic temperature data is consistent with a simple, one-dimensional model of the cooling of a tabular intrusion.
I've used a nice program written by Simon Peacock in the late 80's/early 90's, but it used an old Mac system, and an old Fortran compiler.
Anybody seen anything like this?
*Reference: Carslaw, H.S., and Jaeger, J.C., 1959, Conduction of Heat in Solids: Oxford University Press, 510 p. Umm, the equation is not 510 pages long, though if it were, that would be all the more reason to find some kind of program to help students visualize the results.
Saturday, December 1, 2007
Teaching: thinking globally, observing locally
Yesterday morning, the National Weather Service issued a blizzard warning for my local mountains. It was the perfect set-up for a winter storm: a storm off the coast of Baja California, a jet stream that looped way down to Baja, and then up across central Arizona and straight for our mountains. I was on my next-to-last day discussing weather in my intro class, and it made for a perfect discussion. We could talk about winds, about low and high pressure, about the role of the mountains in controlling the weather in Durango and Denver.
The students were attentive and engaged, in the way that’s only possible when the professor is discussing the possibility of a powder day with a class full of skiers.
And then it fizzled.
It’s been raining. Raining hard. The temperature has stayed in the mid-30’s (F), even through last night. If it had been just a few degrees colder, there would be more than a foot of snow on the ground. But even though it has cooled a bit this afternoon, and there are now some big, fluffy flakes in the air, the snow isn’t sticking. I can see where the snow line probably is: there’s a layer of low clouds around 8000 feet, and that’s where the NWS is currently predicting the snow accumulation stops.
I only live at the edge of the mountains, and the ski area reportedly has two feet of fresh snow, and expects at least another foot. So the students won’t be disappointed.
But the lack of snow down here is important. Snow stays on the ground for months, and a lot of the water soaks into the ground. Rain runs off. And the cold and the snow help the pinyons and the Ponderosas fight off the bark beetles that have been killing the trees and making the summer fire hazards that much worse.
One storm doesn’t mean much. But changes in the snow level are one of the predictions of climate scientists like Jonathan Overpeck (who spoke here a couple years ago). And on Monday I’m talking about climate. So: do I use this storm as an example?
In some ways, that would be a very dangerous thing to do. Many people confuse climate with weather, and assume that if a winter is snowy, or a summer is cool, or a hurricane season is less active than expected, then global warming has turned out to be wrong. But weather and climate are not the same thing: weather is local and short-term; climate is regional or global, and deals with longer-term trends.
On the other hand, global climate can seem distant and irrelevant. Even with CNN and the internet and Google Earth exercises, it’s easier to care about things in one’s own backyard. One of the successes of An Inconvenient Truth, in my opinion, was the way it took a global scientific issue and made it personal, made it worth caring about.
So. Should I use the local weather as an example, and risk students walking out of class convinced that a single storm is what confirms or denies the existence of global warming? Or should I stick with discussing evidence that has been peer-reviewed by specialists, and remember that I’m professionally a structural geologist, not a meteorologist, and I am probably missing some crucial explanation for why this storm appears to be fizzling out, at least at my elevation?
(As I write, of course, the snow has begun to stick. Maybe we’ll get something out of this one after all.)
Teaching: a comment I like to hear
My intro students turned in their papers for my new, kind-of-experimental, revised group project yesterday. One of the students, a senior who had been avoiding science classes for five years, talked to me about the project a number of times, trying to figure out what it all meant.
It was great brainstorming ideas with a motivated student - that's one of my favorite parts of teaching. But the best part of our conversations was one comment she made. She hadn't taken a science class since her junior year in high school, she said... and now she regretted it. Not because she suddenly wanted to be a scientist, but because she felt like she had missed out on something important.
"Why do we take just one science class to fulfill a requirement?"
I'm going to suggest that she take more, just for the fun of it, if she has time before graduating. And if not, there are books, and natural history museums, and public talks, and hikes with guidebooks, and...
Thursday, November 29, 2007
Warping young minds with geologic holiday gifts
Over at Apparent Dip, Thermochronic, Brian, and Chris Rowan have been suggesting some ideas for gifts to entice your favorite young person into geology.
I'll bet everyone can figure out who is responsible for each of these suggestions:
- I predict that a full Bouma sequence would be a big seller, but I can also envision a cute 'bottom-absent' turbidite, and a tough-looking, but lovable, mass transport complex.
- It's the cuddly magnets the kids go for.
- I've been working on a children's book in my head about the "Brave little biotite."
So now I need to wear two hats at once, and play "that weird mom whose kid talks about volcanoes on Mars."
My son is the proud owner of a stuffed T. Rex and a velociraptor puppet. (The velociraptor is kind of scary, and has been banned from the bed. T. Rex, however, does a lot of cuddling when he isn't RARRRRRing.)
I bought this book, Geology Rocks! 50 Hands-on Activities to Explore the Earth for one of my nephews. Activities include "A Quake-Proof Contest!", which involves building blocks and a washing machine, and playing plate tectonics with graham crackers.
His older brother got this for his birthday: Magic Tree House: Tsunamis and Other Disasters. (My sister actually suggested the series, and when we saw the tsunami book, well...)
And I swear I saw a plush trilobite for sale at GSA a couple years ago. I couldn't find it this year, though. The closest thing I've seen on the web is plush Martian life (complete with scientific disagreements about its meaning!), and a few non-extinct invertebrates. At GSA, I was left bringing home things like the official IRIS slinky, a dinosaur-in-an-egg from (I think) Mississippi State, and a spinning light thingy from the Planetary Geology division.
I think the best geologic gift for a little kid, though, would be a great big magnifying glass and a box full of interesting things to look at. (A piece of pumice, maybe, or polished piece of granite, or some sand.) And if you're around the kid, take him or her outside and go exploring. (Have you ever followed critter tracks in the snow, to try to figure out how many legs an animal had, or what it ate? Snow is good for talking about relative ages, too. And, yes, I do ask my four-year-old whether he thinks the rabbit hopped by before or after it stopped snowing. And layers of snow make very nice folds as they start to slide down the car's windshield, so there's even the potential to get into structural geology!)
But I'm open to other suggestions (or for clever ideas that just need the right marketing person).
(If you're shopping for adults, Andrew Alden at about.com has put together a list of geologic gift ideas. Some of them sound pretty good for older kids, too... I like the idea of a plate tectonic globe, or some geologic puzzles.)
Monday, November 26, 2007
Teaching: more on weather journals
John Fleck asked for more info about my weather journal exercise. Here it is.
Every semester, I end Earth Systems Science by talking about weather and climate, and instead of giving quizzes, I make the students keep a weather journal.
Here's what I ask them to do:
1. (3 points) Keep a journal of the weather that occurs for the next three weeks. Every day, record:
➢ maximum and minimum temperatures (temperatures at Durango airport are available from the National Weather Service)
➢ clouds -- how much of the sky is covered (as a percent), what types of clouds are present
➢ precipitation -- does any occur? In what form (rain, drizzle, snow, hail, etc.)? Is it continuous in time or space, or does it occur as showers? How much falls?
➢ wind -- speed (qualitatively) and direction
➢ any other interesting phenomena
Detailed weather observations from the Durango airport are available at http://weather.noaa.gov/weather/current/KDRO.html . You may use the NOAA observations as a source, but I would also like you to include your own observations.
2. (2 points) Explain the weather patterns you observed. Check out weather discussions at the National Weather Service web site (http://www.nws.noaa.gov/) for information about national and global weather patterns.
Why do I do it that way? Well, mostly because that's what I brainstormed the first time I taught the class. But I wanted to create an assignment that would get the students to look at the world around them, and think about what they were learning in class, and connect them together. So when they wake up in the morning and see this:
... they have some idea why there is frost on the car windows but not on the house windows (as was the case at my house on Saturday). Or so, when the smoke from the Durango-Silverton train hangs down in the valley on a cold morning, they realize that they're seeing a temperature inversion.
And I didn't want to make the assignment too complicated - I didn't want them to need access to a barometer, or for them to get up in the middle of the night to measure the temperature.
So does it work? Well, it's hard to say. A few students make great, detailed observations. Other students do the bare minimum. And it seems like it's pretty hard to connect the local observations to bigger picture questions - I would need to have them look at the National Weather Service web site daily, or something.
I also hope that the weather journals will give me some concrete examples of things to discuss in class. I started class this morning (on humidity and the dew point and ways that clouds form) with a picture of frost on my car, and we talked about that (and about the experiences of students who have grown up in more humid climates with a lot of dew). We still didn't end up talking about some of the more interesting things I saw over the weekend, such as the fog that formed at dusk on Friday, after the sun had started sublimating the new snow. (I think - though I'm not certain - that I was seeing something like the crazy freezing fog that Albuquerque had last winter, when the snow sublimated and raised the relative humidity near the ground, and then the cold air near the ground condensed it into fog.)
This morning, however, I asked how many students had described frost in their weather journals. Only a couple students raised their hands. So it doesn't seem like most of them are paying very close attention. They've got a few more days, though, so maybe their observations will improve.
Thursday, November 22, 2007
The wild turkey and the breccia
If it hadn’t been for the wild turkey, we would never have found the breccia.
We were working our way toward a section of a fault zone where two entirely different senses of movement had been described. We had already taken an interesting but physically challenging route to the area, and as a result, we were hurrying to the spot where we expected to find the interesting rocks. And then we saw the turkey.
She – well, at least we thought it was a she – was moving rather slowly across an open area, dragging a wing. I had seen that kind of trick before, when I worked beyond treeline in Alaska, so I figured that she probably had chicks that she wanted us to avoid. So, polite geologists that we were, we decided to follow her.
She led us in a wide circle, back up the hill we had been coming down. No matter, we thought. We could always take a longer route once she was satisfied that her babies were safe.
And then we saw the outcrop. A great wall of rock, on the west side of the saddle. We went and looked at it... and there it was. The fault zone we had been chasing.
We followed it up the hill, found patches of deformed granite caught in the fault zone, and took samples. We haven’t analyzed them yet. Maybe they’re significant. Maybe not.
But we wouldn’t have seen them at all, if it hadn’t been for the wild turkey.
(Image source: Utah's Hogle Zoo. I forgot my camera that day. Oops.)
Happy Thanksgiving to those in the US, and happy Nov. 22 to everyone else.
Wednesday, November 21, 2007
Teaching: understanding graphs
Do you remember when you first learned to read a graph?
I don't. And that might be a problem for teaching.
I'm not talking about the various weird graphs that geologists use. (Stereonets, Ar release spectra, U-Pb concordia plots, ternary phase diagrams... ) I'm talking about a nice, straightforward, x-y plot. Two dimensions, commonplace variables like temperature and time, no logarithmic scales or ratios between variables or anything like that.
(Image source: Global Warming Art) I started thinking about this while explaining a weather journal assignment to my Earth Systems Science class. I cover weather and climate at the end of the semester, in the slot that always gets shorted when I run out of time. But I figure that weather is something that the students ought to be able to observe, at least qualitatively, and I want to give them a reason to read the book and think about it, even when I don't get to all the material in class. So I have them keep a weather journal: every day they have to record temperatures, cloudiness, precipitation, wind direction, and anything they find interesting. The goal isn't to teach them how to professionally record weather observations - the goal is to get them to observe the world around them and relate what they see to the explanations from their book.
This year, I lost nearly an entire class because the students asked one good question: when, and where, and how, should they make their observations?
It's always a bit dangerous when students ask a good question that I don't have a canned answer for. They get to see me think on my feet - not always a pretty sight. And this time, to try to explain my thinking (and perhaps inspired by reading graphical arguments on Tamino’s blog), I started drawing a graph.
It wasn't a very good graph - it was qualitative, illustrative of an idea rather than a compilation of data. But it showed (maybe) what I was trying to illustrate: that temperatures vary throughout the day, so perhaps they should describe their observations qualitatively, and then look at the National Weather Service official maximum and minimum daily temperatures for comparison from one day to another.
I don't know whether the graph made sense to the students or not - I don't have a good technique for quickly assessing whether students understand what I'm saying. I’ve recently learned that graphs don’t make immediate, intuitive sense to a lot of people, and I didn’t take the time to slowly explain what I was showing them. If the graph made sense, then the discussion might have been effective – I asked the class to tell me how the temperature should change throughout the day, and built the graph pretty slowly, so I hope they thought through the problem with me. But if they didn’t understand the graph... well, I might as well have been lecturing in Klingon.
So I’ve been thinking about what I could do to improve their graph comprehension (and to assess whether I’m doing it effectively). The weather journal assignment might be a good place to start – it should be relatively easy for them to graph the daily minimum and maximum temperatures over these three weeks. I wonder if they could use the graph to look at other things – maybe qualitatively annotate the graph with wind direction, wind speed, precipitation, types of clouds, so they could look for patterns? (It seems like that is one of the uses of graphs: they show patterns.)
But when I start thinking about what to make them graph, maybe I’m getting away from the point. What kinds of activities help them really understand what they’re doing?
- Does it help to graph points by hand, or is that simply tedious and frustrating?
- Does it help to graph data they’ve collected, or data related to things they’ve experienced, so the numbers are associated with what they measure?
- How much data is enough, and how much is too much? It seems as though there might be a balance between having enough data to see a pattern, and having so much data that the exercise becomes tedious. (If the students graph data from a spreadsheet, the tedium disappears... but the kinesthetic experience of plotting the dots, and the spatial sense that comes with it, might diminish.)
- If I ask questions about the graph, how do I avoid mistakenly teaching them that correlation = causation? Or is it ok to first see that correlation can help one to figure out causation, and then explain the fallacy?
- Are they going to be too burned out after Thanksgiving to handle an addition to their assignment?
(Side note: there’s a project in the works at SERC to create online modules to give math practice to students in introductory courses. Graph-reading is one concept that the developers may add. If you’ve got math concepts that you need geoscience students to understand, take the survey for the project.)
Monday, November 19, 2007
Back in the day, we used to walk uphill both ways to use a computer...
One of my senior thesis students is using some freeware written by an academic for her senior thesis research. Now, I love freeware, and I am in great debt to people like Rick Allmendinger and Frank Spear and Rod Holcombe and others who write software and then let the rest of us sponge off their hard work and programming expertise - for free.
But occasionally, relicts of operating systems past appear and confuse the heck out of undergrads used to web apps and commercial software packages.
(Image credit: Wikipedia) Today's relict was PostScript. Now, I confess that I've never known much about PostScript, except that it was associated with printing, and that my maps in my dissertation always gave me a "PostScript error" when I tried to print them out. (That was back when we had to walk uphill both ways to the laser printer... *shakes cane at young whippersnappers who have just finished dissertation drafts, hooray!* ) Well, in the process of figuring out how to view the images (open them in Adobe Illustrator, and then edit them to our hearts' content), I ended up looking up the history of PostScript, so I could explain why a piece of software that I first encountered in 1990 would use that particular image format, rather than formats she had heard of.
And that led to stories about using a Mac that didn't have a hard drive.
And at that point, as my student looked at me in horror, I realized it.
I have become one of those people who talks about how it was in the "old days."
(And this was just a few weeks after a student looked at my eighteen-year-old solar-powered pocket calculator and teased me about it, and I threatened to give him a slide rule instead.)
Postscript: You know, I still don't think anything with a GUI interface ought to count as "old technology" - after all, when I was little, I drew pictures on the punch cards that my dad brought home from work, and I remember a computer the size of a small building, complete with flashing lights and beeping sounds. *shakes cane some more*
Wednesday, November 14, 2007
Blueberries and Granite
We didn’t bring enough food into the mountains. We were helicoptered in for three weeks, but after one week, we discovered that we had eaten half the food. So by the beginning of the third week, we were on pretty short rations. When another research group arrived, on schedule, to share dinner with us, things could have gotten ugly. But they didn’t, because our visitors brought instant cheesecake, and we were camped on granite in Alaska.
And granites plus recent glaciation meant blueberries.
(Source: Maine State Berry)
I grew up in Maine, so that’s one wild food that I recognize – and eat, whenever possible. Blueberries are cultivated, even commercially grown, frozen, and sent to grocery stores around the country. But the best ones, in my not-so-humble opinion, grow wild on the barren granitic soil of coastal Maine.
Blueberries are difficult to cultivate, because they thrive in very acidic soil. And that’s why they are found on granite. Natural rainwater is somewhat acidic, due to dissolved carbon dioxide from the atmosphere. Natural soil water can have an even lower pH, due to the formation of organic acids during the decay of vegetation. The rock fragments that make up the rest of the soil can serve as chemical buffers as they weather – calcite (the active ingredient in Tums) dissolves and neutralizes acid, and other minerals consume hydronium ions as they break down by hydrolysis. But quartz doesn’t. It doesn’t dissolve very readily in surface waters, and when it does, it forms a very weak acid. It certainly is no good at neutralizing rainwater or soilwater (or the acid rain that we worried about in New England in the 80’s). And granite contains a lot of quartz. So granite is no good at neutralizing acids.
But it is very, very good at growing blueberries.
Coastal Maine, north and east of Acadia National Park, is intruded by granite after granite, formed during the middle period of Appalachian mountain-building. Several hundred millions of years later, it was scraped clean by continental glaciation, and since then it’s been doing its darnedest to develop something vaguely resembling soil. (If you haven’t guessed: yes, I have attempted to garden in New England. Yes, I have harvested many rocks. Can you guess why I am a geologist and not an agricultural scientist?)
It’s a lousy place to grow corn. Or broccoli. Or, well, most things. But the thin, acidic soil is exactly what the wild blueberries love.
In coastal Maine, the blueberries are harvested commercially. But I’ve worked around the margins of granites in Alaska and Vermont, and I can tell you: the blueberries grow on all of them. If you know the geology, and you look carefully, you can find them.
And then, when you run out of food, you can eat blueberry cheesecake.
(For The Accretionary Wedge #3, Rocks and Life, hosted at The Other 95%.)
Monday, November 12, 2007
The Open Lab is a bit short on earth science posts
I wish I could remember the times this past week when I've seen discussion of the sciences in general, and a list of what's included... and geology wasn't there. I'm hardly the first geo-blogger to notice and comment. But today I noticed a lack someplace else: The Open Laboratory, the science blogging anthology.
There were posts by geoscientists. There were climate and paleontology posts. There were oceanography posts. There were creation-science-debunking posts.
But geology? Nothing.
When I saw that, I nominated one post, but this is a crazy week for me, and I don't have time to find all the great posts I've read in the geoblogosphere in the past six months. And I'm a newcomer, too - I suspect there were a lot of great posts written before I started actively reading.
So help me out here, and let's keep ourselves from being so invisible.
Maybe if the blogosphere acknowledges that geology exists, schoolkids in California and Texas can start studying the earth sciences, too.
Well, I can dream, can't I?
edit: I remembered one of the places where I saw geology left out of a list: at Wikipedia, in its entry on "special sciences" (as philosophers apparently call them; I had never heard the term before).
Here's the relevant text:
The special sciences are those sciences other than physics that are sometimes thought to be reducible to physics, or to stand in some similar relation of dependence to physics as the "fundamental" science. The usual list includes chemistry, biology, neuroscience, and many others.
Perhaps we should be proud that geology isn't on the list - maybe that means we rank above physics in the philosophers' hierarchy. But I suspect that geology isn't on the list because the philosophers don't even think about it existing, or maybe consider it a form of stamp-collecting.
Sunday, November 11, 2007
Could the bogus climate paper be used to teach critical reading?
By this time, you've probably all heard about the fake paper "Carbon dioxide production by benthic bacteria: the death of manmade global warming theory?", published online in the fake Journal of Geoclimatic Studies. (It's been taken down, but the google cache is still here.) A number of people (including Rush Limbaugh) were taken in by it. But my question is: could it be used to help students learn to question confusing literature?
It's hard to get students to critically evaluate published ideas. It's even harder when their eyes cross when they read equations. So: would your students have recognized that this paper is bogus? Could it be used to keep them from assuming abstracts and press releases are settled science? (In this particular case, neither the journal nor the researchers exist, and a quick visit to the University of Arizona's website could confirm that. But... what red flags are in the paper itself?)
My favorite spoof line in the paper is one of the references:
Tibbold, WR and JD Rawsthorne (1998). Miocene, Pliocene and Plasticine fossil records for eukaryotic mass on the West African continental shelf. Journal of Submarine Research 18:5. 196-203.
Plasticine. Heh.
The variables listed are also pretty funny:
"Where Q is raw mass, u is area, c is osmotic conductivity, Ψ is the vertical (neo-Falkian) benthic discontinuity, X is concretised diachronic invariance (P-series), F is trans-dimensional flow structure and jy is the non-rectilineal harmonic regressivity of the constant Δ."
and
"inter-annual variability of the asynchronistic (counterbifurcated) non-tardigrade log run"
and
"the polychromatic "coffeeground" Schumann factor for semi-particulate distribution"
But... you know, I regularly have students read papers that contain math they haven't studied. (Multivariable calculus and linear algebra and differential equations show up reasonably frequently, but our major only requires math through second semester calculus.) And I don't know if they would do more than skim the equations and the references.
If you showed this fake paper to students, what would you ask them to look out for?
Saturday, November 10, 2007
A question of scale
When I started in geology, I wanted to think big. Big collisions between continents, big rifts.
So it may be a bit odd to blog about things that are only a few millimeters across. (Well, I supposed it could be worse; I could be doing sub-atomic physics or something.) But I’ve been thinking small lately, because I got to spend time on an electron microprobe after years away, and I had to explain to a student why, exactly, we were spending hours trying to make sense of one crystal and the minerals surrounding it. Why not collect compositions scattered around the thin section? Why spend so much time trying to characterize one tiny part – what if we were missing something by not looking at the complete picture?
My answer was that sometimes there’s a huge story in a tiny texture. Especially when you’re dealing with metamorphic rocks.
I love metamorphic rocks, but I find them very difficult to explain to non-geologists. Ok, yes, there’s the name: metamorphic = changed shape. Changed by high temperatures and pressures. But there’s a world of chemistry hidden in that statement. The changes are chemical reactions that take place between solid minerals, minerals that no longer can coexist when the pressure is too high for their total volume, or the temperature is too high for their low entropy. Thermodynamics provides a theoretical reason why the minerals should tell a story; the difficult kinetics of the solid-solid reactions mean that it can be possible to tease out the early part of the history of the reactions.
And that means that, sometimes, you can see things like this:
This is a metamorphosed mud-rock that was heated by a nearby body of molten granite. The iron, magnesium, calcium, potassium, aluminum, and silicon are now organized into new minerals. Flakes of brown biotite and colorless muscovite. Garnet, too tiny to make jewelry in this case. Staurolite, honey-brown and cross-shaped in rocks, and pale yellow when cut thin like this. Andalusite, aluminum and silicon and oxygen, grown in long, squarish prisms at low pressures and high temperatures, most likely because it was heated by a magma at shallow (for us metamorphic types) depths............
Wait. That’s not andalusite.
Those dark line in the middle of the image... that’s the cleavage of kyanite, pale blue and beautiful in hand sample, harder to recognize in thin section. Kyanite, which has the same chemical composition as andalusite, but which grows at higher pressures, at greater depth.
That square in the middle – here, I’ll color it so you can see it –
- that square looks for all the world like andalusite. The outcrop is filled with those crystals, pulled apart, but still, in many places, andalusite. But not here.
That one crystal told me the story that I had gradually come to suspect in the years I worked in that field area. The rocks were heated, and deformed, and then buried a little more. (The deformation is evident in the curved lines of biotite around the andalusite. In non-technical terms, that rock’s been squashed after the square thing grew.)
I argued, once, that it had all happened while the granitic magma was intruding. I don’t think anyone has been back to argue otherwise since I stopped working there. But those textures – and other, more mysterious ones on the other side of the granite – those tiny textures are the best evidence I’ve got for a few kilometers of slip on a tricky, poorly exposed fault.
Tiny grains. Tiny textures. They would be easy to miss in any kind of random sampling scheme. But they’re there, and they tell a story.
(Edit: and the tiny thin section photos tell a story about how computer storage has gotten a lot cheaper over the past seven years. Those pictures are little because I took them in the early days of digital photomicrography. And I filled the &#$% hard drive of the computer attached to the camera, and had trouble printing the darn things, too.
Better take new pictures now that we've got a new scope.)
Thursday, November 8, 2007
That "number one on google" meme
I'm late to this meme, but I finally played the I rank number one on Google! meme (originated at The World's Fair).
And here are my results:
1. All of my faults are stress related
2. joy field work
3. structural geology wow
4. sound of mylonites
5. over-excited yeti
Didn't need to use quotes on any of them... which, I guess, implies that I use some unusual combinations of words. Though, really, it's kind of disappointing that "structural geology" and "wow" don't belong together all the time.
I mean...
Wednesday, November 7, 2007
Teaching: testing conceptual models
Here's the scenario:
Students are in a lab, modeling groundwater flow. They make an observation. They come up with an explanation for their observation. And then, they are asked to describe something, anything, they can do to test their model.
They say to make the same observations that they started with.
So. Repeating the experiment is reasonable to see if their observations were just a fluke, or whether they made some mistake. But they've got to do something different if they really want to test their hypothesis.
If I talk to them while they're working on this part of the lab, I tell them that they need to propose to do something different. But if I don't point out that there's a problem with confirming your model by going back to your original data... they don't see that there's a problem.
It strikes me that this is an important point about science, here. And it's a particularly tricky problem for geology, because we constantly look at things that have happened long ago. (That 1.4 billion-year-old granite whose contact aureole I'm studying? It's done intruding, it's cold, it's eroding. It's not going back to the mid-crust any time soon.) So we constantly have to think about what other things our models might predict. Is there any place we haven't looked, or any kind of data that we haven't collected, that could test our model?
If students don't understand that point, it's easy for them to conclude that geology is just a form of story-telling. Not that there's anything wrong with story-telling - I love a good story - but it's much, much more than that. And that, for me, is the fascinating part of it.
But how could I make that point to the students, better than I am doing it now?
Tuesday, November 6, 2007
GSA: making sense of the shapes of rocks
I'm a structural geologist. And that means that when I see something like this:
or this:
... well, my first reaction is "oh, WOW!" But my second reaction is to squint a little, tilt my head to the side, and ask (usually silently, unless I'm teaching): "I wonder how that formed?"
Structural geology is a funny discipline. It has borrowed a lot of ideas from other fields (especially engineering and old-school Newtonian physics, but also from other subdisciplines in geology), and then built on them and redeveloped them for decades. And sometimes, when I teach the class, it feels like a bit of a hodge-podge of ideas. In particular, there are two somewhat different approaches to trying to understand a structure: kinematics and mechanics. Kinematics deals with the changes that a body of rock undergoes when it deforms – how does a rock of one shape change into a rock of another shape? Mechanics deals with the forces and stresses that cause a rock to change shape, and tries to predict the shapes of the final structures through the behavior of a certain material under certain stresses.
If you’re anything like I was when I read my first structural geology textbook, your eyes just crossed and you have absolutely no idea what I just said. So let me try again, but with an example.
Take, for instance, the San Rafael Swell (the second photo). The rock layers used to be flat-lying sediments. They aren't flat any more. How did they get all tilted up like that? The simplest way to explain monoclines (like the San Rafael Swell) is to imagine two wooden blocks underneath a couple thick blankets. Push one wooden block up, and the blankets are folded. Voila... monocline, above what’s known as a blind thrust fault.
Except that there are some space problems in my little sketch, and in my pile of blankets. My cat and my four-year-old’s stuffed blue puppy could hide in my model (and there’s something a bit scary about the image of a giant stuffed blue puppy hiding somewhere within the upper Paleozoic section of the San Rafael Swell... ). So the possible explanations are limited, first, by geometry: there’s a fixed volume of rock to work with, unless something odd happens.
There have been a variety of geometric and kinematic models for folded beds above fault tips. There’s John Suppe’s fault-propagation fold model, which is shown in most structural geology textbooks:
Suppe’s models fold the rocks above the fault, but don’t fold the rocks below the fault. They’re relatively easy to work with geometrically, though – the rock layers stay the same thickness, so it’s possible to draw them by hand.
There are more complicated kinematic models, such as the trishear models that many people, including Eric Erslev and Rick Allmendinger, work with:
Trishear models recognize that rocks deform both above and below the fault, and describe the deformation as occurring in a triangular zone with its apex at the fault tip. There are a number of parameters that can be varied, which makes it possible to fit the model very nicely to real faults and folds.
We talked about trishear models in my Advanced Structural Geology class – read Eric Erslev’s paper, and played with Rick Allmendinger’s software. But when we discussed them, the students had one big question: why do the rocks behave like that? They change shape in this triangular zone... but why?
Well, I have no idea, but I suspect that the answer would lie in rock mechanics. Which I’m not very good at. The basics, though, would involve thinking about what is required to break a rock, and what stresses bend a rock, and maybe would involve calculating the energy involved. And then all those equations get put into a computer model that predicts the changes in shape from the physics, and you get... well... I’m trying to find a good image, because I know that some very talented people have worked on blind faults from a rock mechanics perspective, but I’m having trouble finding an image that I understand, let alone one that I can explain.
There was a session on integrating kinematics and mechanics at the Geological Society of America meeting last week... but it didn’t answer my questions. There were mechanically modeled structures that looked reasonable, and others that raised more questions for me than they answered.
But my conclusion, at the end, was that there’s a lot more work to be done, to reconcile the physics of rock behavior with the geometry that results.
Which is probably good news for people who want to do research in structural geology...
Sunday, November 4, 2007
Teeny-tiny partial melt
I just got back from a two-day microprobe marathon - two days on what's essentially a scanning electron microscope that can do chemical analyses of very small crystals.
Here's one of our images:
It captures the coldest melt that occurs in metamorphic rocks: the partial melting of muscovite. Muscovite is the glittery, flaky mineral used for things like making eye shadow sparkle. It's very common in metamorphosed shales, but it gradually gets used up in metamorphic reactions as temperature goes up, until finally it reacts with quartz to grow sillimanite (the tiny fibers in the image) and potassium feldspar. And it can also melt, a little.
And this one did.
There's a tiny bleb that looks like a pair of sunglasses in the middle of the grain. Maybe if I outline it you'll see it:
Most of the bleb is made up of quartz (qtz). But the tiny bright spot in the middle is potassium feldspar (kfs) - exactly what you should see if the muscovite (mu) melted a little bit, and then the melt crystallized without ever escaping.
1.4 billion years ago, this rock melted. A little. (There were also a few little dikes in the field, but because we were in a contact aureole, we weren't sure if they were in situ partial melts, or if they were part of the granite. Now I suspect they were in situ melts.)
Wednesday, October 31, 2007
GSA: getting there is half the fun
I live a seven-hour drive from Denver. There's an airport near me, but the flights are expensive and frequently delayed or cancelled, so when I have to go to Denver, I drive.
A seven-hour drive can be rough... unless it looks like this:
My drive takes me up into the headwaters of the San Juan River, over the continental divide, and into the headwaters of the Rio Grande, Arkansas River, and South Platte River. People go out of their way to vacation in the places that I have to drive through to get to Denver.
The photo is of the northern Sangre de Cristo mountains, on the eastern side of the Rio Grande Rift. The peaks are Precambrian igneous and metamorphic rocks, sillimanite grade and partially melted - I did my senior thesis research in the area. Further to the south, the Precambrian is covered by layers of sedimentary rock, all tilted towards the east, away from the fault. The range front is a normal fault, possibly still active. The valley is filled with sediments: lots of alluvial fan gravels, interbedded with lake sediments from wetter times. The western side of the valley is much less dramatic: hills of Tertiary volcanic rocks from the San Juan field are partially buried by the young gravels. Streams in the area feed an artesian groundwater system - as I drove across yesterday, I could see crusts of white minerals on the soil, left behind from evaporation of standing water. The Great Sand Dunes National Park is along the range front - the sand is carried into the valley by streams, and then blown back along the valley by the prevailing west winds. It's a particularly beautiful example of a half graben.
There was a session (that I missed, unfortunately) on groundwater and tectonics of the Rio Grande Rift. It focused more on the Albuquerque area (for good reason: there are a lot of people using that groundwater down there); the abstracts for the session are here.
I love that valley. High, open, dry. Snow-capped peaks. And a little bit of tectonics, where North America has been pulled a little bit apart, west of the plains and east of the Colorado Plateau.
Sunday, October 28, 2007
GSA: everyday science
There are stories about a session at the American Geophysical Union in 1966, when it finally became clear to the audience that sea-floor spreading was real and that the continents really did move. Apparently some other recent AGU meetings have had that sort of feel in sessions about climate change - Chris Mooney describes one in Storm World. But the Geological Society of America meetings that I've attended... they just haven't been like that.
Every talk is fifteen minutes long. Fifteen minutes, in which to make a case that one's ideas or data should change the way we interpret things. Fifteen minutes to convince a room of structural geologists that we really should start with equations of conservation of momentum, as Dave Pollard tried this afternoon. Fifteen minutes to try to explain why rotations determined from paleomagnetic data don't fit those predicted from estimates of strike-slip motion along Laramide structures. (If the model never fits the interpretations of the field data, something's got to be going on - either we don't understand the structures, or we don't understand what kind of rotation the structures should cause.) It's enough time to raise a few questions, maybe even to make a well-constructed argument... and then it's on to the next.
In part, it's the nature of science: most of what we do is incremental, fitting new data into existing models, tweaking the ideas here and there when the data don't quite fit with previous understanding. In part, it's the way the talks work: they are progress reports, ways to raise questions before submitting the long version of the research for rigorous peer review.
So what's the most interesting thing I saw today? Well, there was one talk (in a structure modeling session) testing a hypothesis for entraining layers of debris in the toe of a glacier... which concluded that, no, thrust faults couldn't form in a glacier. (It's nice to see someone come to a conclusion that, no, a model doesn't work.) And I learned, little by little, about mechanical modeling - but I didn't come away with the conclusion that my explanations for a certain group of structures have been totally wrong all this time.
My biggest conclusion for the day is that I need to do a better job of teaching quantitative skills in structural geology. Which isn't really a new conclusion at all.
But perhaps that is not so unsual.
And maybe, if I had wanted to have some paradigms shifted, I should have sat in the Mars sessions. (There will be another one tomorrow. I'm going to go, at least for a while.)
Friday, October 26, 2007
Pre-GSA Public Service Announcements
First, one future announcement: the Cutting Edge people are planning a follow-up session to the Teaching Structural Geology and Teaching Petrology workshops at the Rocky Mtn/Cordilleran Section GSA meeting (March 19-21 in Las Vegas). The abstract deadline in Dec. 11. The session isn't on the GSA website yet - look for it after the national meeting is
done. Oh, and there will probably be an associated field trip. I'm looking forward to the opportunity to discuss how to teach Cordilleran structure!
Now, about GSA...
Geoscience Educators Social Reception
Saturday, 27 October, 2007
5:00 - 7:00 pm
Colorado Convention Center, Hall F
Geobloggers dinner?
We tentatively planned to meet Sunday after the opening reception. I don't know the time or place. Sports bars may be rather crowded Sunday night...
World Series
If you've got a hotel room and a late plane flight, make sure to contact your hotel. Don't let your hotel room get given away to a baseball fan...
GSA. Be there.. or be a cricket fan, I guess. (I was going to say "or be a Yankees fan," but we can't all be originally from New England and currently from Colorado, and perfectly willing to switch allegiances depending on quality of the pitching on any given night. :D )
And with that, I've got a long but beautiful drive to make, and way too many exams to grade. Hope to see some of you in Denver.
Monday, October 22, 2007
Links: drought in Turkey & SE US, Tambora, visualizing climate change
Some links to things I've been reading (and thinking about for classes):
RealClimate has a guest post from Figen Mekik about climate change and drought in the Mediterranean. It's a great combination of a personal perspective (Mekik is originally from Turkey) and explanation of the processes involved. In particular, Mekik explains the North Atlantic Oscillation, which I've always found confusing... but which is kind of an Atlantic version of El Nino, and which can have an important impact on weather in Europe, North Africa, and North America.
John Fleck has been watching the drought in Georgia and blogging about what the historical record shows. Is the problem with climate, or with population growth, in this case? (The definition of drought, after all, depends on how much water a given area needs.)
For anyone who, like me, needs a good source of images for climate change lectures: the global warming art site. I recognize the graphs from the peer-reviewed literature (and the wiki pages associated with them have all the references). And it's really nice to have access to the graphics in color, and in an easy format for importing. (Thanks to Michael Tobis and John Fleck for the links.)
And, finally, remembering "the year without a summer" and the eruption of Tambora. I heard the story on NPR this morning while I was driving in. In 1816, people starved in Europe, and New England had snow in the middle of the summer... all because of the eruption of a volcano on the other side of the world. Tambora's eruption was bigger than Krakatoa's (which also had a cooling effect later in the century). (Thermochronic had a great post about Tambora, as well, and connected it to the writing of Frankenstein and with landscape paintings.)

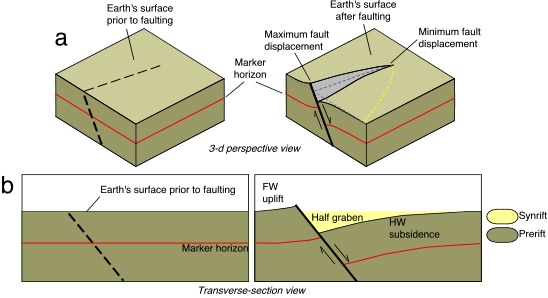